

is State Bank of India Safe?

State Bank of India logo.
The largest banks by total assets in the United States and India, respectively, JPMorgan Chase & Co. (JPM) and the State Bank of India (SBI) are two large-scale firms with stock publicly traded throughout the globe. With operation centers in a swath of different countries, the influence of each firm is by no means confined to a certain population, with their businesses each providing employment to over 200,000 individuals. Established in July of 1955 as the Imperial Bank of India was transformed into the State Bank of India, SBI’s prowess is still young as compared to JPM–a bank with roots extending into the late 18th century.
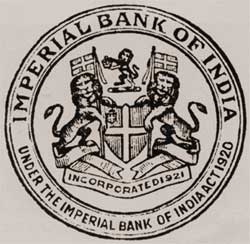
Seal of Imperial Bank of India
is State Bank of India Safe?
This gap, separating the two firms based on their time in operation, is evident when examining their respective values. While SBI boasts a market cap of just over $62 billion, centuries of global prowess have allowed JPM’s to climb to over $400 billion. Further, as of March, 2023, JPM’s total asset pool of $3.744 trillion accounted for about 14% of the US market share by deposits, while SBI’s assets valued at $750 billion accounted for 25% of the Indian market share. Both banks play critical roles in stimulating economies in their respective countries and globally as well, providing employment opportunities and allowing large-scale institutions to secure significant sums of money–however, it is still important to understand the key similarities and differences between the two.

Share of the Bank of Bengal, issued 13 May 1876
To begin, it is important to acknowledge the respective structures of each firm. Descending from the Bank of Calcutta, SBI is the product of the merger and acquisition of over twenty different banks, eventually taking on its current name in 1955. In the late 1960s, SBI acquired control of seven additional regional banks in India.
is State Bank of India Safe?
Plans to undergo a complete merger into one large firm began in 2008, with the idea finally executed in 2017 when the Union Council of Ministers approved the decision. JPM is similarly the product of a series of mergers and acquisitions of regional and associate banks, with the most recent (and perhaps most well-known) being the merger of JPMorgan & Co Incorporated with Chase Manhattan Bank, giving rise to JPMorgan Chase & Co as it is known today.
Both firms have stock that is publicly traded. With shares of SBI listed on the Bombay Stock Exchange. And the London Stock Exchange. To provide a few examples–however, one major difference arises as we examine each firm’s shareholders. In total, over 70% of JPM shares are controlled by “institutional ownership,”. With mutual funds and management corporations holding the vast majority of the firm’s stock. However, as of March 15, 2017. The most prominent shareholder of SBI was the Government of India, holding over 60% stake in the firm.
The breakdown of JPMorgan’s shareholders reveals the ways in which the entirety of the firm’s stock is actively traded, with no large organizational or government ownership–however, for the State Bank of India, it is evident that a large portion of the bank’s stock is stagnant, with a prominent government shareholder giving rise to a large portion of stock that is likely traded with little to no frequency. With these similarities and differences in mind, it is important to now examine the recent performance of each firm.
is State Bank of India Safe?
Both JPM and SBI have reported significant increases in earnings in their most recent public reports. JPM’s 2023 first quarter report reveals a net income of $12.6 billion, showing a 52% increase YoY; more specifically, the bank reported that Consumer and Community Banking contributed most heavily to the firm’s earnings, with an individual net income of over $5 billion.
Similarly, SBI reports a net income of nearly $2 billion in its most recent public release, representing an 83.2% increase in earnings from the same quarter in 2022.
Both firms seem to be thriving in respect to overall profitability, and both return on equity and return on assets reveal similar numbers for both banks.
JPM reported an overall ROA of 1.38% and an ROE of 18% in the first quarter of 2023, with the Consumer and Community Banking sector of the bank reporting an individual ROE of 40%. Similarly, SBI reported an ROA of 1.23%, an increase of 49 basis points YoY, and an ROE of 19.43%. These data reveal fairly similar trends between the two firms, representing a common ability to successfully generate income based on the investments that each bank makes with its capital. One final metric to examine is the non-performing asset (NPA) ratio made public by each firm. To note, while SBI saw their NPA ratio fall from 0.77% to 0.67% YoY, NPA remained fairly stagnant for JPM at 0.1% this quarter, reflecting not only stable credit quality but also an increasing profitability on significant asset pools for both firms.
So far in 2023, it is evident that both the State Bank of India and JPMorgan Chase & Co. have been successful in generating significant revenue, with both banks seeing increases in net income YoY; however, it is also important to note where these firms reported losses.
While SBI did not report charge offs in their most recent earnings report, JPM stated that charge offs were up $555 million in the first quarter of 2023, a number largely driven by the firm’s Card Services with a net charge off rate of 2.07%. Additionally, $1.1 trillion in average loans for the quarter, up 6% YoY, is a likely indicator for this increase in charge offs, as a larger number of total loans brings with it an inherent risk of failure. While providing insight into the fate of JPM’s loans over the first quarter of 2023, another desirable metric is one published by both SBI and JPM: provision for credit losses.
This value represents the potential losses accounted for by a bank due to loan risks, providing information about the success of loans for a given firm.
With this in mind, JPM reported a provision for credit losses of just over $2 billion in the first quarter of 2023, a 55% increase YoY–however, on the other hand, SBI reported a provision of just over $150 million, a 60% decrease YoY. While average loans between the two firms are not quite comparable for the quarter, with just over $35 billion for SBI and around $1 trillion for JPM, it still appears that SBI has seen more stability with these loans and less of a need to account for risk and potential loan failure.
is State Bank of India Safe?
Both JPMorgan Chase & Co. and the State Bank of India are firms that play a pivotal role in stimulating economies throughout the globe–however, I would like to finish this piece by discussing the ways in which each bank holds stock that seems to be promising. Stock for JPM currently trades at $143.26, about a 6% increase in price YoY. On the other hand, stock for SBI trades at ₹571.3, or $6.97, which represents about a 6% decrease in price since June of 2022.
While both stocks hold a similar dividend yield–2.79% for JPM and 1.98% for SBI–the significantly higher stock price for JPMorgan Chase & Co would inherently provide a higher annualized dividend for a given trader; while paying more for a single share, an investor would get more out of a share of JPM’s stock than one of SBI. Finally, a similar price/earnings ratio for both companies at around 10 reveals that the stocks are similarly valued, another metric in which both companies stand close to equal. While I have not come to a complete conclusion about which stock is more promising, these data points released by each bank are critical in helping a trader decide where to invest their money.
Bibliography:
Kramer, John. “JPM | JPMorgan Chase & Co.. Stock Price & News – WSJ.” The Wall Street Journal, June 16, 2023. https://www.wsj.com/market-data/quotes/JPM.
First Quarter 2023 Results. JPMorgan Chase & Co, April 14, 2023. https://www.jpmorganchase.com/content/dam/jpmc/jpmorgan-chase-and-co/investor-relations/documents/quarterly-earnings/2023/1st-quarter/be0fc3a0-c499-4af9-933c-6e7f75025097.pdf.
“SBI History.” SBI Board of Directors-About Us, June 2, 2022. https://sbi.co.in/web/about-us/about-us.
Q4FY23 Results. State Bank of India, April 10, 2023. https://sbi.co.in/documents/17836/1275616/180523-SBI+Press+Release+FY23.pdf/a2089310-821e-50b9-099c-fa0879846f02?t=1684399745004.
“JPMorgan Chase (JPM) – Total Assets.” Companies ranked by market capitalization, 2023. https://companiesmarketcap.com/jp-morgan-chase/total-assets/#:~:text=Total%20assets%20on%20the%20balance,cash%20equivalents%2C%20properties%20and%20equipment.
is State Bank of India Safe?
is State Bank of India Safe?

According to Moody’s:
“Comerica’s unrealized losses represent 40% of its common equity tier 1 capital, which is a bank’s highest-quality capital because it is fully available to cover losses.
Is US Bank In Trouble?
This percentage is even higher at U.S. Bancorp: Unrealized losses represent almost 60% of this tier 1 capital. The unrealized losses represent 40% of First Republic Bank’s tier 1 capital but about 80% of the bank’s customers are uninsured.
For comparison, unrealized losses constituted between 30% and 40% of common equity tier 1 capital for Signature Bank and 120% for SVB.”
Furthermore, if you look at the stock price US Bank faces trouble. However, they are awash in cash and liquidity. And as we all know, if we keep less than $250,000 in one account, we have the backing of the FDIC! See for details: FDIC insurance | U.S. Bank (usbank.com).
Of course at the same time, everyone wants to know how healthy their bank stands! And so let’s dig in!
Below we have a chart showing unrealized depreciation on Hold to Maturity Securities (HTM) for top 100 banks versus equity.
These unrealized losses NOT reflected in profits or a deduct to equity via Other Comprehensive Income (OCI) – only in the footnotes! Moreover, we don’t find these losses reflected in stress tests or measures of capital adequacy.
Furthermore a 25 bp (1/4 of 1 percent) increase in rates for a 10-year security causes approximately 2 points in losses (100 par to 98 to reflect yield discount).
Looks pretty fantastic for US Bank! Less than 20% of its net equity finds itself impaired by long-term loan losses.
As a result, we wonder is USB stock a buy?
Bank of America claims sterling health and they find nearly half of their equity impaired by losses on loans. Of course, neither bank plans to sell these loans. However, as SVB showed us, when a bank run occurs, a bank needs every dollar it can access. See our piece: How Did Silicon Valley Bank Fail?
Of course, now things seem different as the Federal government decided to backstop all banks. So from an existential standpoint, there is no risk. Of course, who knows, politicians can change their minds!
For more coverage on the bank crisis see our pieces:
In fact with this federal backstop, even famous short seller and market cynic thins the crisis might be over. See our piece: What is Michael Burry holding?
Lately all we can read about these days are banks failing everywhere! Are we in a financial crisis? Now some worry will Bank of America collapse? And many others worry whether or not will Wells Fargo fail?
And of course, many others worry about whether the more local establishments can keep breathing. Will First Republic Bank fail? Or is my money Safe in Schwab?
US Bank is a financial institution that provides a wide range of banking and financial services to individuals, businesses, and institutions.
Founded in 1863 as the First National Bank of Cincinnati. Over the years, the bank underwent several mergers and acquisitions, expanding its operations and geographic reach. In 1966, the bank changed its name to United States National Bank of Oregon and, in 1997, it adopted its current name, US Bank.
In the last two decades, US Bank grew significantly.
According to its financial reports, the bank’s total assets increased from $162 billion in 2001 to over $600 billion in assets today, representing a growth rate of over 240%. The bank also expanded its operations into new markets, acquired other financial institutions, and diversified its product offerings.
One of the key drivers of US Bank’s growth has been its focus on digital banking and technology. In recent years, the bank has invested heavily in digital infrastructure, launching mobile banking apps, online account management tools, and other digital services to meet the evolving needs of its customers.

In conclusion, US Bank’s history finds itself marked by growth, innovation, and a commitment to providing high-quality banking services to its customers.

U.S. Bancorp – U.S. Bancorp Annual Report 2010 (Referrer:About U.S. Bancorp–Annual Meeting
Is US Bank In Trouble?
How Did Silicon Valley Bank Fail?
Silicon Valley Bank Blinders

The Silicon Valley Bank failure strikes me as a colossal failure of bank regulation, and instructive on how rotten the whole edifice is. I write this post in an inquisitive spirit. I don’t know the details of how SVB was regulated, and I hope some readers do and can chime in.
As reported so far by media, the collapse was breathtakingly simple. SVB paid a bit higher interest rates than the measly 0.01% (yes) that Chase offers. It attracted large deposits from venture capital backed firms in the valley. Crucially, only the first $250,000 become insured, so most of those deposits are uninsured. The deposits are financially savvy customers who know they have to get in line first should anything go wrong. SVB put much of that money into long-maturity bonds, hoping to reap the difference between slightly higher long-term interest rates and what it pays on deposits. But as we’ve known for hundreds of years, if interest rates rise, then the market value of those long-term bonds fall. Now if everyone comes asking for their money back, the assets are not worth enough to pay everyone back.
In sum, you have “duration mismatch” plus run-prone uninsured depositors.
We teach this in the first week of an MBA or undergraduate banking class. This isn’t crypto or derivatives or special purpose vehicles or anything fancy.
Where were the regulators? The Dodd Frank act added hundreds of thousands of pages of regulations, and an army of hundreds of regulators. The Fed enacts “stress tests” in case regular regulation fails. How can this massive architecture fail to spot basic duration mismatch and a massive run-prone deposit base? It’s not hard to fix, either. Banks can quickly enter swap contracts to cheaply alter their exposure to interest rate risk without selling the whole asset portfolio.
Michael Cembalist assembled numbers. This wasn’t hard to see.

Even Q3 2022 — a long time ago — SVB was a huge outlier in having next to no retail deposits (vertical axis, “sticky” because they are insured and regular people), and a huge asset base of loans and securities.
Michael then asks
.. how much duration risk did each bank take in its investment portfolio during the deposit surge, and how much was invested at the lows in Treasury and Agency yields? As a proxy for these questions now that rates have risen, we can examine the impact on Common Equity Tier 1 Capital ratios from an assumed immediate realization of unrealized securities losses … That’s what is shown in the first chart: again, SVB was in a duration world of its own as of the end of 2022, which is remarkable given its funding profile shown earlier.

Again, in simpler terms. “Capital” is the value of assets (loans, securities) less debt (mostly deposits). But banks are allowed to put long-term assets into a “hold to maturity” bucket, and not count declines in the market value of those assets. That’s great, unless people knock on the door and ask for their money now, in which case the bank has to sell the securities, and then it realizes the market value. Michael simply asked how much each bank was worth in Q42002 if it actually had to sell its assets. A bit less in each case — except SVB (third from left) where the answer is essentially zero. And Michael just used public data. This is not a hard calculation for the Fed’s team of dozens of regulators assigned to each large bank.
Perhaps the rules are at fault?
If a regulator allows “hold to maturity” accounting, then, as above, they might think the bank is fine. But are regulators really so blind? Are the hundreds of thousands of pages of rules stopping them from making basic duration calculations that you can do in an afternoon? If so, a bonfire is in order.
This isn’t the first time. Notice that when SBF was pillaging FTX customer funds for proprietary trading, the SEC did not say “we knew all about this but didn’t have enough rules to stop it.” The Bank of England just missed a collapse of pension funds who were doing exactly the same thing: borrowing against their long bonds to double up, and forgetting that occasionally markets go the wrong way and you have to sell to make margin calls. (That’s week 2 of the MBA class.)
Ben Eisen and Andrew Ackerman in WSJ ask the right question (10 minutes before I started writing this post!) Where Were the Regulators as SVB Crashed?
“The aftermath of these two cases is evidence of a significant supervisory problem,” said Karen Petrou, managing partner of Federal Financial Analytics, a regulatory advisory firm for the banking industry. “That’s why we have fleets of bank examiners, and that’s what they’re supposed to be doing.”
The Federal Reserve was the primary federal regulator for both banks.
Notably, the risks at the two firms were lurking in plain sight. A rapid rise in assets and deposits was recorded on their balance sheets, and mounting losses on bond holdings were evident in notes to their financial statements.
moreover,
“Rapid growth should always be at least a yellow flag for supervisors,” said Daniel Tarullo, a former Federal Reserve governor who was the central bank’s point person on regulation following the financial crisis…
In addition, nearly 90% of SVB’s deposits were uninsured, making them more prone to flight in times of trouble since the Federal Deposit Insurance Corp. doesn’t stand behind them.
90% is a big number. Hard to miss. The article echoes some confusion about “liquidity”
SVB and Silvergate both had less onerous liquidity rules than the biggest banks. In the wake of the failures, regulators may take a fresh look at liquidity rules,…
This is absolutely not about liquidity.
SBV would have been underwater if it sold all its securities at the bid prices. Also
Silvergate and SVB may have been particularly susceptible to the change in economic conditions because they concentrated their businesses in boom-bust sectors…
That suggests the need for regulators to take a broader view of the risks in the financial system. “All the financial regulators need to start taking charge and thinking through the structural consequences of what’s happening right now,” she [Saule Omarova] said
Absolutely not! I think the problem may be that regulators are taking “big views,” like climate stress tests. This is basic Finance 101 measure duration risk and hot money deposits. This needs a narrow view!
There is a larger implication. The Fed faces many headwinds in its interest rate raising effort. For example, each point of higher real interest rates raises interest costs on the debt by about $250 billion (1 percent x 100% debt/GDP ratio). A rate rise that leads to recession will lead to more stimulus and bailout, which is what fed inflation in the first place.
But now we have another. If the Fed has allowed duration risk to seep in to the too-big to fail banking system, then interest rate rises will induce the hard choice between yet more bailout and a financial storm. Let us hope the problem is more limited – as Michael’s graphs suggest.
Why did SVB do it?
How could they be so blind to the idea that interest rates might rise? Why did Silicon Valley startups risk cash, that they now claim will force them to bankruptcy, in uninsured deposits? Well, they’re already clamoring for a bailout. And given 2020, in which the Fed bailed out even money market funds, the idea that surely a bailout will rescue us should anything go wrong might have had something to do with it.
(On the startup bailout. It is claimed that the startups who put all their cash in SVB will now be forced to close, so get going with the bailout now. It is not startups who lose money, it is their venture capital investors, and it is they who benefit from the bailout.
Let us presume they don’t suffer sunk cost fallacy. You have a great company, worth investing $10 million. The company loses $5 million of your cash before they had a chance to spend it. That loss obviously has nothing to do with the company’s prospects. What do you do? Obviously, pony up another $5 million and get it going again. And tell them to put their cash in a real bank this time.)
How could this enormous regulatory architecture miss something so simple?
This is something we should be asking more generally. 8% inflation. Apparently simple bank failures. What went wrong? Everyone I know at the Fed are smart, hard working, honest and dedicated public servants. It’s about the least political agency in Washington. Yet how can we be seeing such simple o-ring level failures?
I can only conclude that this overall architecture — allow large leverage, assume regulators will spot risks — is inherently broken. If such good people are working in a system that cannot spot something so simple, the project is hopeless. After all, a portfolio of long-term treasuries is about the safest thing on the planet — unless it is financed by hot money deposits. Why do we have teams of regulators looking over the safest assets on the planet? And failing? Time to start over, as I argued in Towards a run free financial system
Or… back to my first question, am I missing something?
****
Updates:
A nice explainer thread (HT marginal revolution). VC invests in a new company. SVB offers an additional few million in debt, with one catch, the company must use SVB as the bank for deposits. Furthrmore, SVB invests the deposits in long-term mortgage backed securities. SVB basically prints up money to use for its investment!
“SVB goes to founders right after they raise a very, very expensive venture round from top venture firms offering:
– 10-30% of the round in debt
– 12-24 month term
– interest only with a balloon payment
– at a rate just above prime
For investors, it also seems like a no-downside scenario for your portfolio: Give up 10-25 bps in dilution for a gigantic credit facility at functionally zero interest rate.
If your PortCo doesn’t need it, the cash just sits. If they do, it might save them in a crunch. The deals typically have deposit covenants attached. Meaning: you borrow from us, you bank with us.
And everyone is broadly okay with that deal. It’s a pretty easy sell! “You need somewhere to put your money. Why not put it with us and get cheap capital too?”

Written by Stanford Professor John H. Cochrane
John H. Cochrane is a senior fellow at the Hoover Institution. He is also a research associate of the National Bureau of Economic Research and an adjunct scholar of the CATO Institute.
Before joining Hoover, Cochrane was a Professor of Finance at the University of Chicago’s Booth School of Business, and earlier at its Economics Department. Cochrane earned a bachelor’s degree in physics at MIT and his PhD in economics at the University of California at Berkeley. He was a junior staff economist on the Council of Economic Advisers (1982–83).
Cochrane’s recent publications include the book Asset Pricing and articles on dynamics in stock and bond markets.
In addition, the volatility of exchange rates, the term structure of interest rates, the returns to venture capital, liquidity premiums in stock prices, the relation between stock prices and business cycles, and option pricing when investors can’t perfectly hedge. His monetary economics publications include articles on the relationship between deficits and inflation, the effects of monetary policy, and the fiscal theory of the price level. He has also written articles on macroeconomics, health insurance, time-series econometrics, financial regulation, and other topics. He was a coauthor of The Squam Lake Report. His Asset Pricing PhD class is available online via Coursera.
Cochrane frequently contributes editorial opinion essays to the Wall Street Journal, Bloomberg.com, and other publications. Lastly, he maintains the Grumpy Economist blog.
The Grumpy Economist: Silicon Valley Bank Blinders (johnhcochrane.blogspot.com)
is State Bank of India Safe?
is State Bank of India Safe?
US bank trouble heralds end of dollar reserve system –
is State Bank of India Safe?
is State Bank of India Safe?
is State Bank of India Safe?
is State Bank of India Safe?


